Crime Statistics
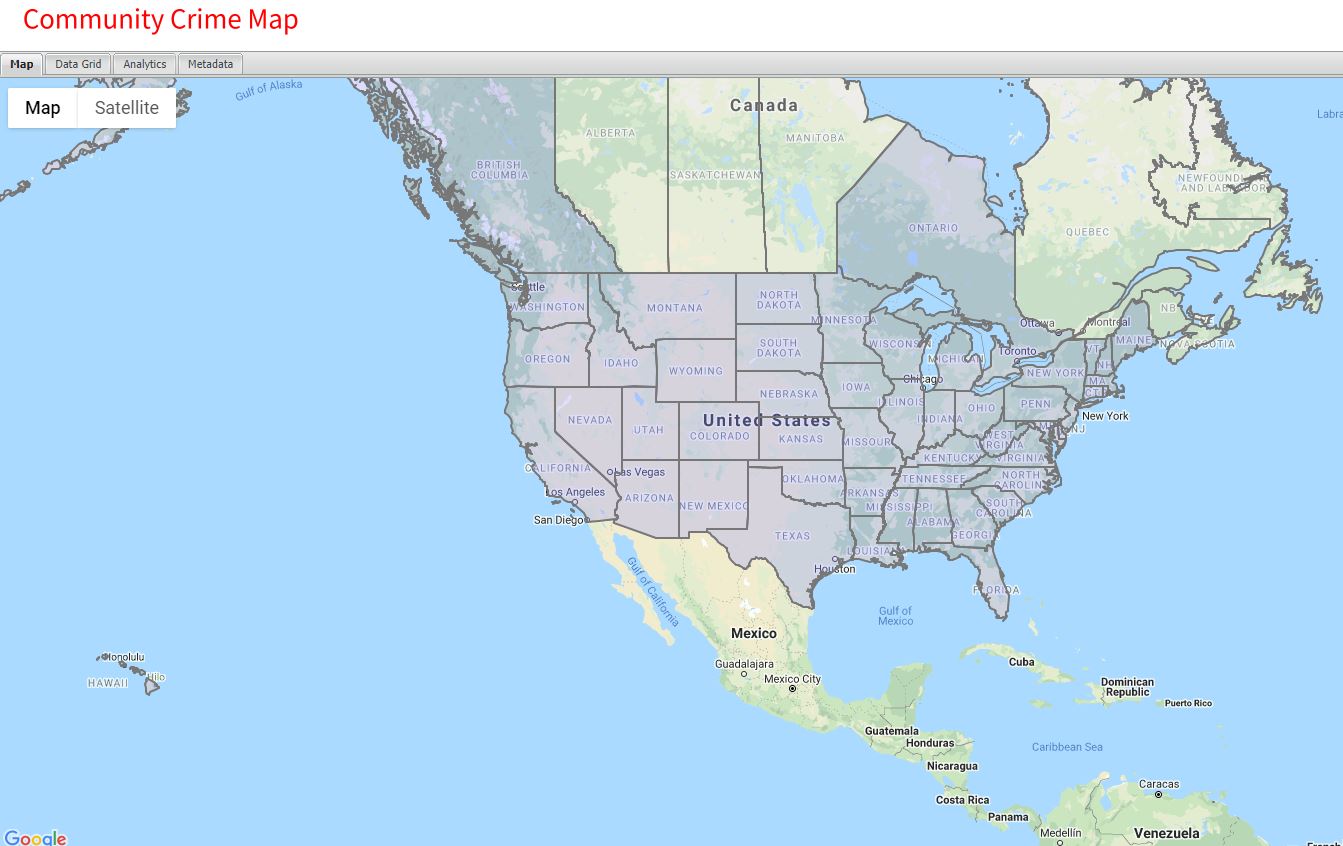
Crime mapping helps the public get a better idea of the crime activity in their area so they can make more informed decisions about how to stay safe.
The Takoma Park Police Department Annual Reports are available here:
- 2008 Takoma Park Police Annual Report
- 2009 Takoma Park Police Annual Report
- 2010 Takoma Park Police Annual Report
- 2011 Takoma Park Police Annual Report
- 2012 Takoma Park Police Annual Report
- 2013 Takoma Park Police Annual Report
- 2014 Takoma Park Police Annual Report
- 2017 Takoma Park Police Annual Report
- 2018 Takoma Park Police Annual Report
- 2019 Takoma Park Police Annual Report
- 2020 Takoma Park Police Annual Report
- 2021 Takoma Park Police Annual Report
- 2022 Takoma Park Police Annual Report
- 2023 Takoma Park Police Annual Report
Quarterly Crime Statistics:
1st Quarter 2022: Overall, Part 1 crimes are down by 11.47% (from 218 to 193 reported crimes) compared to the 1st Quarter of 2021. The City has seen a decrease in several Part 1 crimes: Homicide is down by 66.67% (from 3 to 1 reported crimes), Rape is down by 66.67% (from 3 to 1 reported crimes), Robbery is down by 42.86% (from 14 to 8 reported crimes), Auto Theft is down by 31.82% (from 22 to 15 reported crimes), and Theft From Auto is down by 42.71% (from 96 to 55 reported crimes).
However, Assaults have increased by 475% (from 4 to 23 reported crimes) in the 1st Quarter of 2022, compared to that in 2021, and Larceny has increased by 23.33% (from 60 to 74 reported crimes) in the 1st Quarter of 2022, compared to the 1st Quarter in 2021. There was also an increase in overall crime in Ward 3 and Ward 4 compared to last year’s 1st Quarter. Ward 3 increased by 21.88% (from 32 to 39 reported crimes) and ward 4 increased by 7.69% (from 13 to 14 reported crimes). A review of all 1st Quarter Crime reports revealed Ward 6 encompasses the majority of reported crime statistics with approximately 45% of the overall crime stats within the City.
Full Report: 1st Quarter 2022 Crime Statistics
Total Crime - Yearly
| Year | Homicide | Rape | Robbery | Assault | Burglary | Larceny | Auto Theft | TOTAL |
|---|---|---|---|---|---|---|---|---|
| 2008 | 0 | 4 | 80 | 38 | 135 | 383 | 99 | 739 |
| 2009 | 0 | 3 | 46 | 35 | 104 | 429 | 61 | 678 |
| 2010 | 0 | 1 | 48 | 26 | 150 | 364 | 63 | 652 |
| 2011 | 1 | 3 | 32 | 26 | 109 | 317 | 77 | 565 |
| 2012 | 0 | 1 | 42 | 16 | 73 | 364 | 54 | 550 |
| 2013 | 1 | 2 | 36 | 20 | 125 | 302 | 42 | 528 |
| 2014 | 1 | 3 | 35 | 17 | 125 | 430 | 53 | 664 |
| 2015 | 1 | 5 | 25 | 23 | 126 | 405 | 32 | 617 |
| 2016 | 1 | 2 | 27 | 40 | 101 | 293 | 33 | 497 |
| 2017 | 0 | 3 | 29 | 19 | 55 | 359 | 30 | 495 |
| 2018 | 0 | 0 | 19 | 21 | 54 | 343 | 25 | 462 |
2019 Year Crime Summary by Ward
| Crime | Ward 1 | Ward 2 | Ward 3 | Ward 4 | Ward 5 | Ward 6 | TOTAL |
|---|---|---|---|---|---|---|---|
| Homicide | 0 | 0 | 0 | 0 | 0 | 0 | 0 |
| Rape | 1 | 1 | 0 | 1 | 2 | 2 | 7 |
| Robbery | 3 | 0 | 1 | 3 | 3 | 17 | 27 |
| Assault | 3 | 2 | 2 | 6 | 7 | 11 | 52 |
| Burglary | 9 | 11 | 10 | 3 | 6 | 11 | 50 |
| Theft | 78 | 42 | 51 | 17 | 33 | 122 | 343 |
| Auto theft | 3 | 1 | 5 | 5 | 1 | 10 | 25 |
| TOTAL | 97 | 57 | 69 | 35 | 52 | 173 | 483 |

