Data-driven approach to disaster/pandemic response
At the January 2021 City Council Priorities meeting, interest was expressed in getting a better sense of social vulnerability in Takoma Park to help in taking a data-driven approach to disaster/pandemic response. To meet this, the City prepared three interactive maps allowing residents to explore the CDC’s Social Vulnerability Index—a measure of the neighborhoods and counties that could face a disaster—and its components.
The CDC updates the Social Vulnerability Index every two years to assist communities in disaster preparedness, defining social vulnerability as “potential negative effects on communities caused by external stresses on human health.”
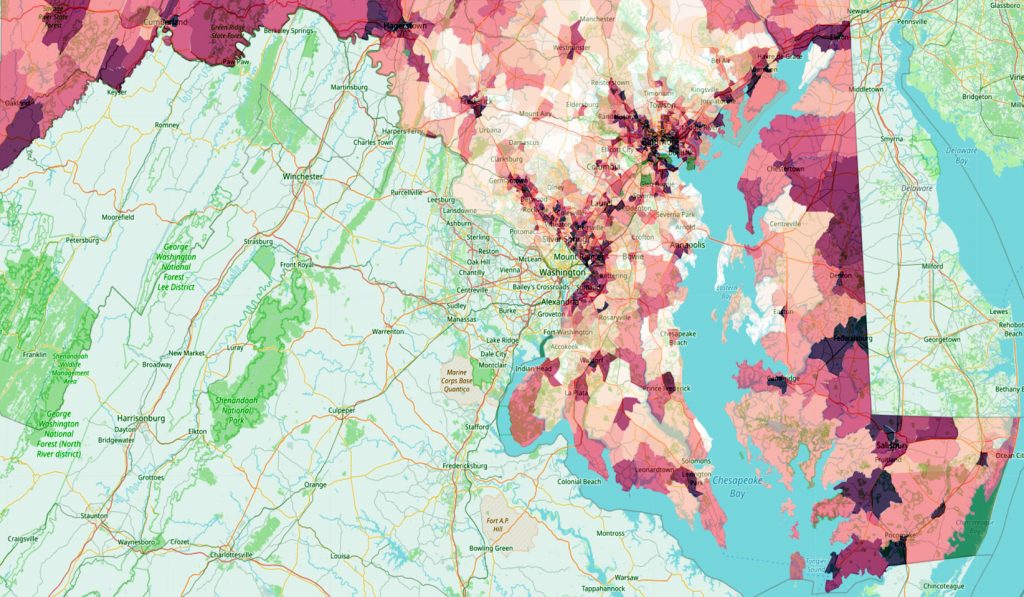
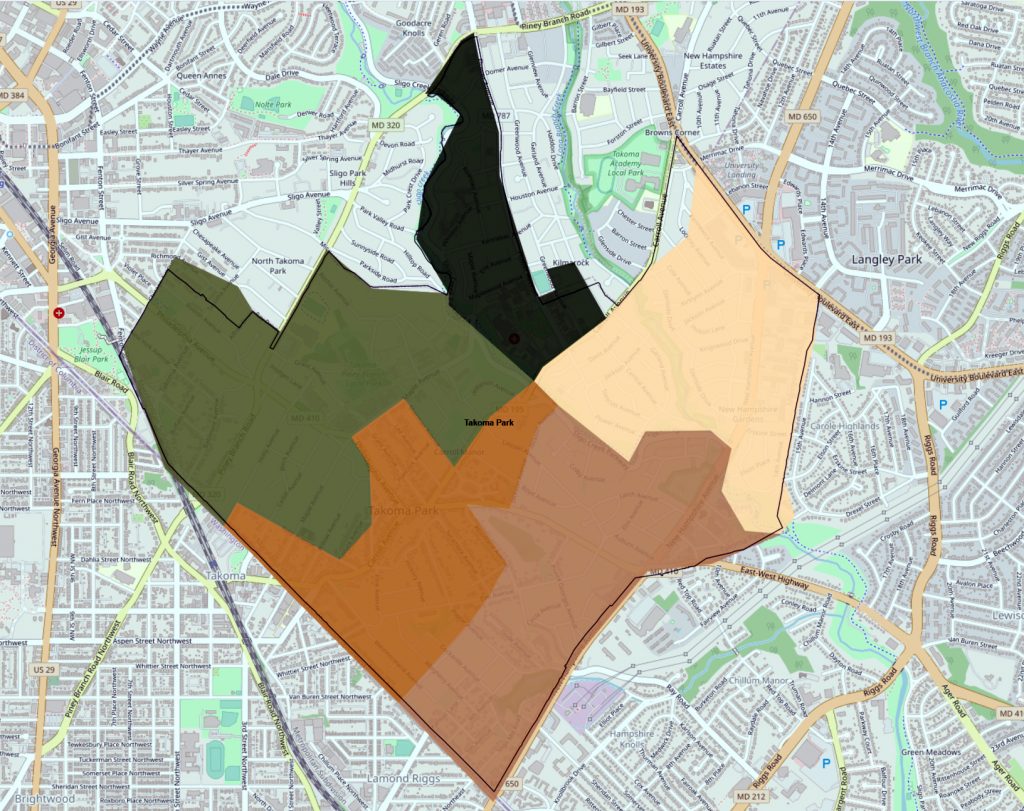
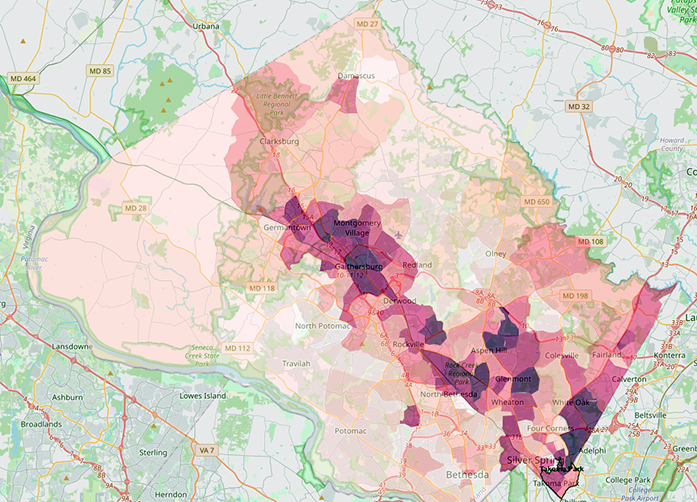
The maps included here show Social Vulnerability Index data at the Census tract level—geography defined by the U.S. Census Bureau used in administering the Census—for all tracts in Takoma Park; for all tracts in Montgomery County; and for all tracts in Maryland.
There are three levels to the index, all displayed in the maps:
The Social Vulnerability Index itself, acting as an overall measure of social vulnerability to disaster. In the maps, the index is measured in percentile terms, comparing each tract against all other tracts in Maryland. For example, a tract in the 87th percentile of the Social Vulnerability Index has a higher social vulnerability score than 87% of all other tracts in Maryland.
Four subindices that make up the index, called themes, representing different aspects of social vulnerability:
- socioeconomic status,
- household composition,
- race/ethnicity/language,
- and housing/transportation.
These are also expressed in percentile terms compared to all other tracts in Maryland.
The themes are made up of fifteen component census variables. For example, the percent of people in poverty in a tract and the tract’s unemployment rate is part of the socioeconomic status theme, and the percent of people in housing with more people than rooms is a part of the housing/transportation theme. In the maps, these variables are shaded the same color as the theme they help make up; for example, the percent of people in a tract under 17 is shaded orange and so is the theme it helps the makeup, the household/disability theme. The fifteen component census variables are expressed in terms of their actual values, not their percentile values.
Switching between the maps can be useful to get a sense of how tracts in Takoma Park compare in different elements of social vulnerability with each other, with other tracts in Montgomery County, or with tracts across Maryland.
For more granular information on neighborhoods in Takoma Park, the City’s Planning Department maintains an interactive demographic map, showing select demographic variables for Takoma Park at the census block group level (smaller geography than tracts). To see the code used to produce this map, you can access the City’s Github repository on the City Github page at this link.
Click Images to View CDC Social Vulnerability Maps or links below:
2018 Takoma Park
2018 Montgomery County Map below
2018 State of Maryland Map below