Takoma Park Data Explorer
The City of Takoma Park is pleased to announce the release of the Takoma Park Data Explorer, a one-stop shop for members of the public to learn more about the City and its residents through data.
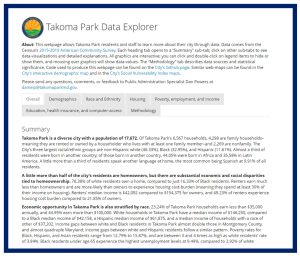
The Data Explorer provides summary text and visualizations of selected Census American Community Survey data for 2016-2020, including the city’s demographics, racial and economic inequalities, and access to broadband internet among residents. All visualizations are interactive, letting interested residents go further in exploring Census data. The Data Explorer webpage also compares results for Takoma Park to Montgomery County and Maryland, identifying statistically significant differences in results for the City compared to the state and county.
Instructions for how to use the Data Explorer can be found here. A video with instructions for the Explorer will be posted soon.
The Data Explorer is organized into tabs and sub-tabs that users can move between:
- An “Overall” tab provides a summary of data analyzed throughout the Explorer.
- The “Methodology” tab includes methodological information and instructions on how to use the explorer.
- Each other tab is subject-based: Demographics; Race and Ethnicity; Housing; Poverty, employment, and income; and Education, health insurance, and computer access.
Subject-based tabs include sub-tabs:
- They begin with a “Summary” sub-tab with text describing data on that subject, with other sub-tabs containing visualizations and descriptions on specific sub-topics.
- For example, the “Poverty, employment, and income” tab includes sub-tabs on income, poverty, and unemployment.
Data on race and ethnicity is spread throughout subject area sub-tabs and consolidated in the “Race and Ethnicity” tab. For instance, the “Housing” tab includes visualizations on “Homeownership by race;” the same visualization appears in the “Housing” sub-tab of the “Race and Ethnicity” tab.
The Explorer will be updated each year with the most recent 5-year American Community Survey data, allowing residents continued access to up-to-date information about the City.
Over time, the City may add other visualizations or text to the Explorer; a date and description of each update can be found in the “Updates and citations” section of the “Methodology” tab. The code used to produce the Explorer can be found on the City’s GitHub page.