
Learn about your Neighborhood with Interactive Maps
Planning and Community Development staff have created a series of interactive maps as a way to visualize the community through different lenses. These tools will inform decision-making about access to and improvements in public space.
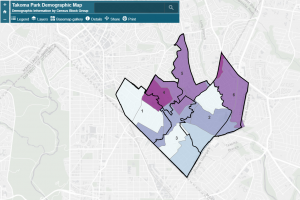
Layers in the Demographic Map allow one to view concentrations of residents based on data from the 2014-2018 American Community Survey such as minority populations, the elderly or youth, households below the poverty level and more.
The Park Inventory Map shows the location of both City and County parks within Takoma Park, what amenities can be found at each location, and a quality rating. Choose among the available layers to find the nearest picnic table, basketball hoop, or public art.
The Park Quality and Proximity Map overlays the location and quality and types of parks with racial demographics provided by census data. This map displays the average walking time to all parks in the City from each census block group.
For more information on this and other ongoing programs visit: Planning and Community Development section.